Food commodity footprints
The food sector is responsible for a large portion of greenhouse gas emissions, which drive global climate change. The sector also relies on the labor and production of millions of small-scale farmers and agricultural workers in the regions most vulnerable to the effects of climate change.
Explore the graphics below to see how much greenhouse gas some of the world’s major food commodities emit — from staples like rice to speciality commodities like coffee — and the level of water scarcity in the regions they’re grown. Also, read the stories of the farmers who grow these commodities are being impacted by climate change.
 Download the report
 Global footprints:
Greenhouse gasses produced annually by each commodity Tonnes of CO2 equivalent
Global production of each commodity Tonnes per year
Annual global water scarcity footprint per commodity Cubic meters of water equivalents. Water scarcity is a factor of water used in irrigation and regional water scarcity indicators.
Regional footprints:
Greenhouse gasses produced annually by each commodity Tonnes of CO2 equivalent
Regional production of each commodity Tonnes per year
Annual regional water scarcity footprint per commodity Cubic meters of water equivalents. Water scarcity is a factor of water used in irrigation and regional water scarcity indicators.
Notes
- The 25 countries with the most overall vulnerability to agricultural productivity loss, according to the Center for Global Development
Meet an affected farmer
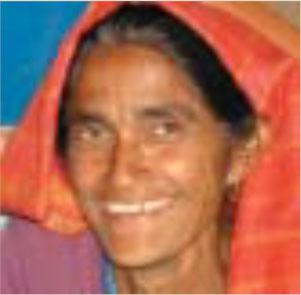
Padma Bohora
Alatal Village, Nepal
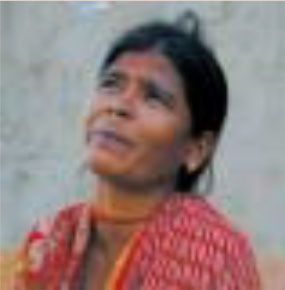
“There has been no rain this winter, and the monsoon doesn't arrive on time anymore. Four or five years ago we grew enough rice and wheat to eat for five months, now it is not enough for one month. Before we had lots of green vegetables, fruits and sugarcane, but now we can grow very little, only where there is water close by.” Due to lack of rain, Padma Bohora has seen her rice harvest decrease significantly.
Thongsa Juansang
Kham-keun Kaew district, Thailand
“Even with the water we have, it is not enough for both jasmine rice and sticky rice cultivation. We decided to keep sticky rice for our family consumption. Instead of jasmine rice, we grow organic watermelon, vegetables, and some other fruits, which do not require much water, for family consumption and to sell to the local market. Even though we do not have enough rice for sale next year, we are still in a better situation when compared with other farmers who did not prepare themselves for the drought of this year.” Thongsa Juansang’s rice cultivation has been deeply impacted by drought.
Gistado Gallaron
Tanauan, Phillippines
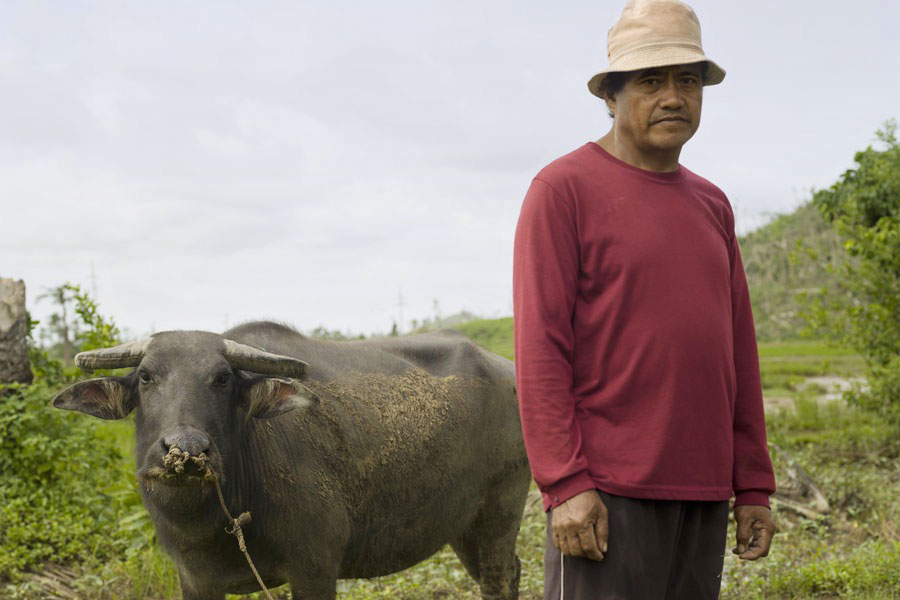
Gistado Gallaron suffered greatly after Hurricane Yolanda hit, destroying his home and flooding his rice fields, he said. The damage took a toll on his income and prevented him from being able to fully support his family.
Shefali Mrithunjoy
Vabanipur, Bangladesh
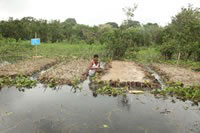
“We have felt so helpless, with nothing to do but watch our precious crops be destroyed by floods that came too early, before harvest.” Shefali Mrithunjoy has been trying to find new ways to harvest her crops in the midst of unpredictable and recurring flashfloods in her area. “We have shifted to growing a kind of rice with a shorter growing time, hoping to harvest them before the flashfloods come”.
Charles Kenani
Mnembo, Malawi
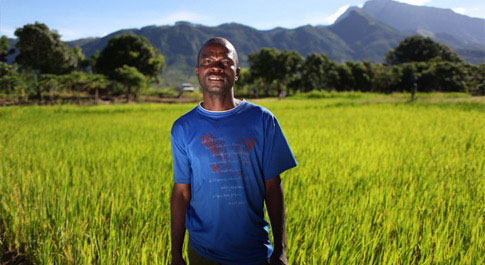
The effects of climate change were making it impossible for Charles Kenani to grow enough food to feed his family. “We were finding it hard to grow enough food all year round. It's impossible to harvest enough for the whole year when you have to rely on the rain.” As a response he built an irrigation system to protect his rice harvest from failing from the lack of rain in the dry months.
Mukelabai Liywalii
Liyoyelo, Zambia
In Liyoyelo village, Zambia, the Liywalii family lost its entire maize crop in a flood that destroyed everything including their house. Mukelabai Liywalii is still stunned as she looks at what remains of her home. “We put all our children in the canoe and paddled about 25km. We could not save our crops, so we have no food. We are eating nothing.” Climate change has made flooding a more frequent occurrence in her village.
Sefya Funge
Adamii Tulluu-Jido Kombolcha, Ethiopia
Sefya Funge has been growing and selling crops to earn a living, but has seen her maize harvests suffer due to weather variability. “The biggest change is the rain doesn’t come on time anymore. The rain used to come regularly, and we were able to plant and harvest on time. After we plant, the rain stops just as our crops start to grow. And it begins to rain after the crops have already been ruined.”
Li Zhuang
Gansu, China
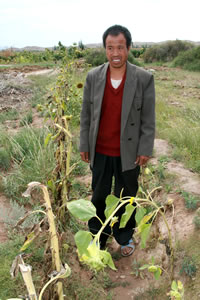
“I want more rain.” This is the wish of wheat farmer Li Zhuang and likely most of the 20 million others living in China’s arid northwest province of Gansu. They all depend on regular water for their livelihood, yet they’ve seen droughts and sandstorms intensify over the last few years due to climate change. Li's family lost a third of their wheat crop in 2008 as a result of a sandstorm.
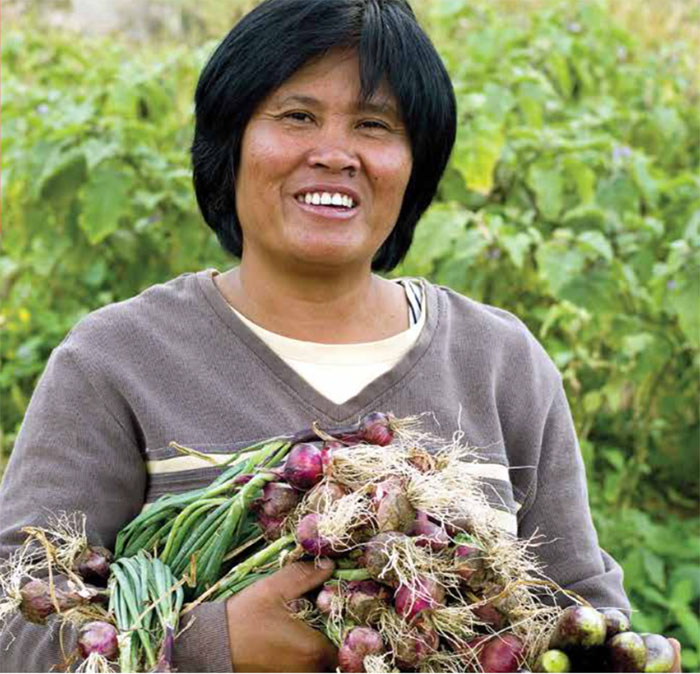
Eusebia Teramba de Ramos
Tunari province, Bolivia
“We depend on our small plot of land for the food we eat. I grow potatoes but also wheat, beans, oca, papa lisa (a variety of potato) and oats. But we are short of water. When I was young there was plenty of water, now there isn’t.” Eusebia Teramba de Ramos faces many challenges as the lack of water makes sowing crops and getting sufficient yields from them difficult in recent years. Climate change has led to much less rainfall and more unpredictable weather in Bolivia.
Binita Bishowkarma
Baitadi District, Nepal
“In the last three years there has been no snow, and in one of those years we had only two days of rain. So now the plants are dying.” Binita Bishowkarma has seen her wheat harvest affected by the dry weather. Fruits like peaches, lemons and pomegranates are not flowering due to the conditions.
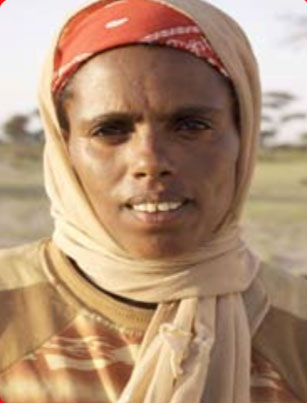
Birtukan Dagnachew
Ethiopia
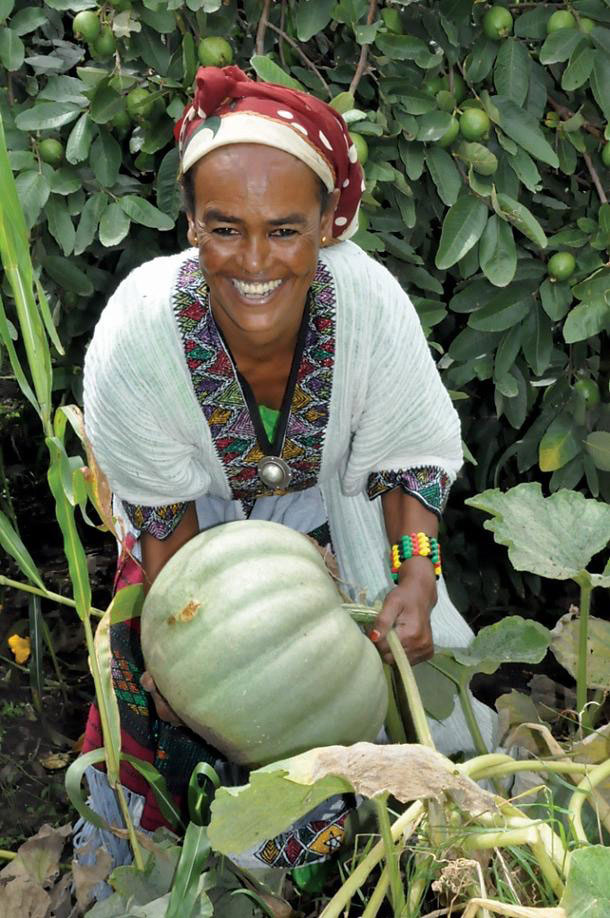
Birtukan Dagnachew began farming to help support herself after her husband passed away. “Farming is very hard work, I do not think there is a right word to express the excessive physical labor smallholder farmers invest on their land.” She started planting bananas, papaya and other fruits that would conserve water in order to adapt to the drought-prone region she lives in.
Gistado Gallaron
Tanauan, Phillippines
Before Hurricane Yolanda, Gistado relied on coconut trees that bore plenty of fruit to support his family. After the storm, his coconut trees were ruined. “The thought of having no livelihood was devastating for us. And of course, our house was totally destroyed, we had nowhere to go, we had nowhere to sleep.”
Crispin Miranda
Leyte Island, Philippines
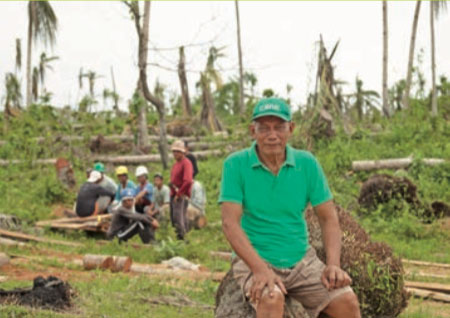
Crispin Miranda survived the typhoons that wiped out crops and left many with no way to earn a living. “When we went to the farm, we saw the damage. No home, no plants, no crops.” He is now clearing the damaged coconut trees and processing the wood so it can be used to rebuild houses.
Josephine Alad-Ad
Mindanao, Philippines
“It’s painful to see my crops fail. It makes my heart ache.” Josephine Alad-Ad has seen the harvests of her tomatoes and othercrops plummet with the rise of erratic weather. “Last year it rained too much all the time, and now this year we are experiencing a drought.”
Shefali Mrithunjoy
Vabanipur, Bangladesh
“Even though there was rain in the summer, it seldom caused any real damage. Now rainstorms are fiercer and the monsoon winds are as early as April, suddenly causing these new flashfloods. We have felt so helpless, with nothing to do but watch our precious crops be destroyed by floods that came too early, before harvest.” Shefali Mrithunjoy is trying to find other ways of farming to adapt to changes in the climate. She grows crops like tomatoes and herbs early to try to avoid flashfloods destroying her harvests.